Bajaj Auto Reports 25% Fall in 2018 – Lets Analyze
Bajaj-Auto comes back to 2017 & below 2018 losing 25% since 2018 Jan. Let’s analyze the fall & see where the opportunity is.
Bajaj-Auto reported Q3 FY19 results yesterday, EBITDA fell 6% to 1156 Q3FY19 from 1232 Q3FY18, Net profit rise to 1102cr from 952cr Q3FY18.
Market experts considering this result as a mixed bag but all domestic & international volume growth surges to 1.25 million from 1 million, depicting strong growth over 25% YoY.
Gaining market share in International market. Exports rising. Overall, result failed to make investors & trader happy that led the share price fall more than 3% to below 2500 from 2600 level.
In 2018 Jan, Bajaj-Auto share price rose to 3468 from level of 2600 level in 2017 Jan, more than 33%, now price is back to below level of 2600 and hovers at 2500 level.
Despite rising volume and net profit, company gaining market share, their exports rising yet it failed to cheer the investors & trader in 2018, and the sentiment led the price fell more than 25% in a year.
On this chart, we can see price making uptrend to downtrend, price went to 3400 in 2018 Jan from 2600 level in 2017 jan, after it went back & below 2600 level to 2500 level from 3400 this year, forming Head & Shoulders that has been observed last year.
Many reversals & continuation patterns can be observed in this chart 1, such as rising wedge reversal, 123 breakout, TSI negative divergence from 2016 Oct to 2017 Oct, and most important, breaking out the neckline near 2800 level which led the price towards 2600 & eventually below 2550, many supports has breached towards making new supports.
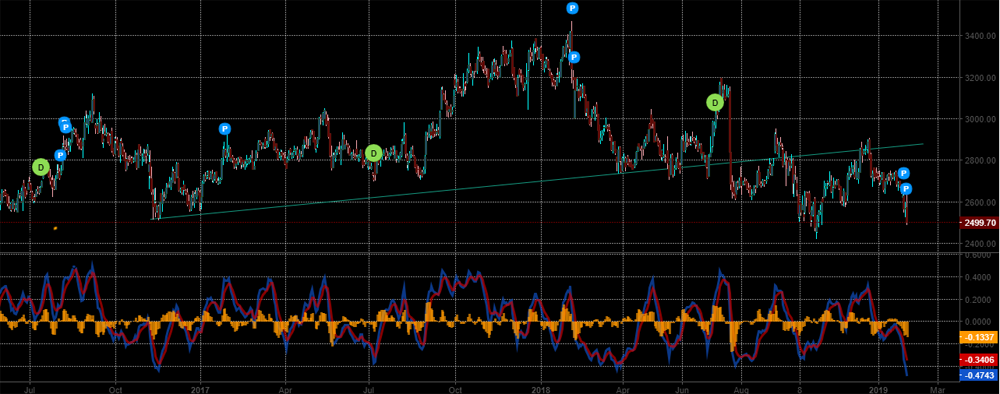
Chart 1. Bajaj-Auto 2016 july to present.
Describing Levels & Patterns:
Head & Shoulder.
Head = 3468
Left Shoulder Level = 3030
Right Shoulder Level = 3200
Neckline Breakout = 2800
Neckline Slight Slanting towards uptrend which makes the pattern significant.
123 Breakout & Small Rising Wedge can be seen between 2018 July top to dec.
From this chart, one can see the price heading to level of 2400 & below the 2350, attaining the target level that we estimate from H&S pattern, and can see the continuation of downtrend.
On this hourly chart, we can see the price trending up from Oct 2018, price reaching up to 2900 from 2500 level, making small channel that eventually broke below 2750.
Support near 2600 breaking up, & on earning day, we’re seeing price breaching below 2550.
Many reversals & continuation patterns can be observed in chart 2, such as small head & shoulder in hourly chart from oct 2018 till 2019 mid Jan. Rising Channel breaking out. Indicators: CCI & DMI CCI was making negative divergence along with DMI during 2018 Dec to 2019 Mid Jan.
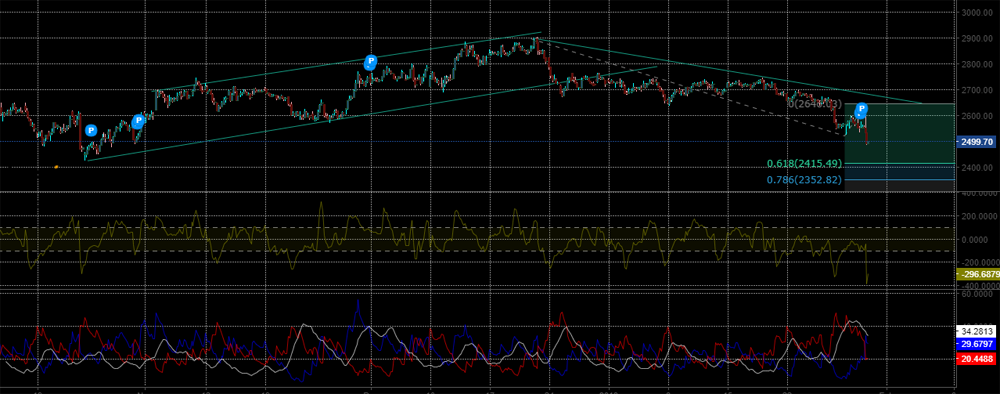
Chart 2. Bajaj-Auto, Hourly, 2018 Oct to Present.
Describing Levels & Patterns:
Head = 2900
LS = 2720
RS = 2750
Neckline Level = 2610, (Slanting Up)
Fib Extn. forecasting level
.618 = 2415
.786 = 2352
DMI suggesting trend continue after price retracing from bouncing back near 2585 level.
This chart is for observing the Fib Resistance & Support line along with 123 break out system.
We can see Fib RS line suggesting trend to continue towards 2430 support level, price may find difficulty to break out the .786 resistance line near 2600. Instead, projecting the level near 2450 on coming days unless some reversal come.
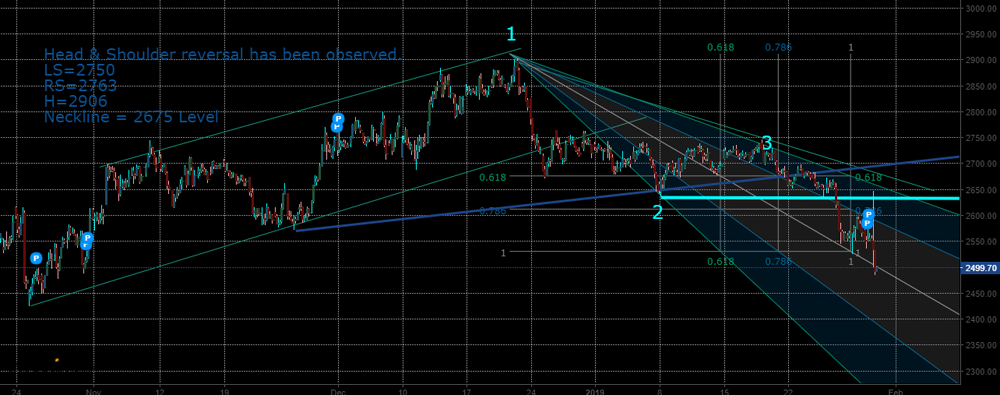
Chart 3. Bajaj-Auto, Hourly, Fib Resistance & Support Line, Oct 2018 till present
This reports comprising many factors after earnings, also technical analysis report suggesting & projecting price level that can be helpful to investors & traders.