Budget or Just a Hoax

Is 2019 Budget going to be as the way it supposed to be or is it going be just a Hoax as it always is?
This budget is going to be a full of surprises as it may decide the win for the BJP. We see this budget as a election budget. Investors, Voters & SMEs are all suffering from GST & demonetization, no investor will ever be happy after paying taxes on LTCG(Long-Term-Capital-Gains). Apart from these setbacks they are constant failure to create jobs in the country. So, BJP will try to divert their focus from these setbacks and will have to consider the streets expectations in this budget.
We witnessed major setbacks in our economy and market, such factors were demonetization, GST, or 10% Tax on LTCG in excess of Rs.1 Lakh, we know this government introduces many policies and reforms just to win political enthusiasm for their voters and workers.
It is obvious that this budget is going to be one side budget just to win election.
Apart from micro analysis of the interim budget, let’s know what market experts are expecting from this budget.
Such expectations are:
a. Deduction on tax slab & increased the slab more than Rs. 3 lakh.
b. House Loan Rate Deduction to Rs. 3 to 5 Lakh.
c. Increasing amount on LTCG slab which is 10% in excess of Rs. 1 Lakh, & some even expecting from government to withdraw LTCG tax as we all know it was a major setback for the market and ignited the outflow in market.
d. Expectation of scraping the dividend tax. Companies pay 15% tax on Dividend distribution, Equity funds pay 10% on dividend which market experts don’t want. These taxes opposes investors enthusiasm to beat the market return. There are many other expectations such as excluding ELSS (Equity-Linked-Saving-Scheme) scheme from section 80 C deduction to help retail investors, but we believe if there are less taxes on LTCG or dividend then it will help to increase the liquidity in market which eventually helps the economy.
Where are we headed this quarter during 2019 budget.
This budget can help Nifty to break above the resistance and 11100 levels if it meets the street expectation. Our perspective differs a little and little less optimistic than streets or TVs analyst forecast.
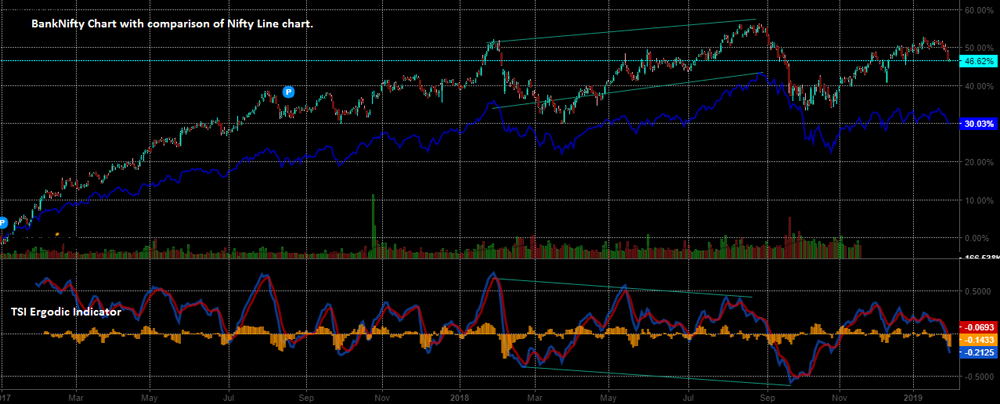
Chart 1. Banknifty Candlestick chart with comparison of Nifty Line chart from 2017 to present
We can see in chart 1 Banknifty outperforming than nifty since 2017, Banknifty is 46% up from 2017 level while Nifty is up only 30%. We’re seeing banknifty relative ratio with Nifty to recede. Banknifty P/E ratio is more than 50, depicting negative divergence and tells overvalued. Nifty 500 P/E is more than 24 which tells a little less overvalued as banks are. In this chart, we can observe double tops, that level never get breached in year 2018. Double bottom never get breached below their level. Now, we observed rising channel breakout which tells a correction with retracement target near 25700 level
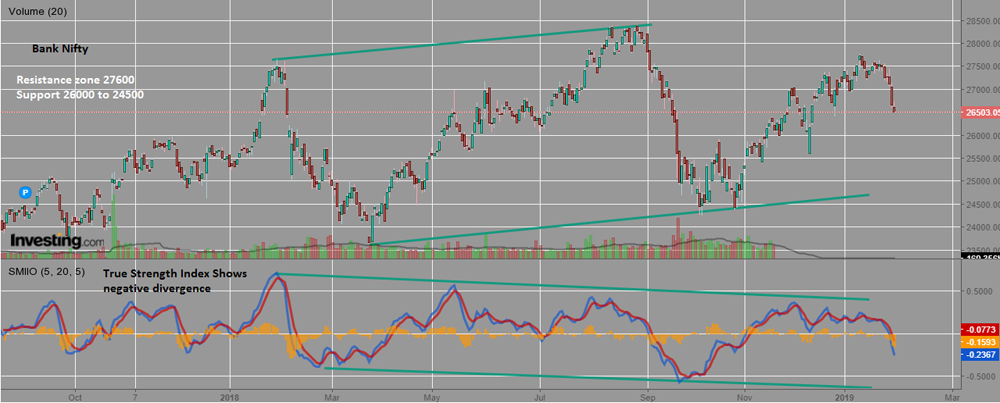
Chart 2. Banknifty chart since Sept 2017 to present.
We can see in chart 2 Banknifty’s performance since 2017 Sept. TSI indicator shows major negative divergence which tells a correction to come, as we witnessed meltdown in last week from 27500 to level of 26500 and still plummeting, we see price heading towards level of 26000 & even lower than that. 50% Retracement from Nov2018 level of 24400 to Jan2019 level of 27600 gives a level of 25900 which we believe to be tested soon.
But, this week and after the budget outcomes, market will be speculative and we see vix price will hovers in range of 14 to 20, which tells us that market will be highly volatile.
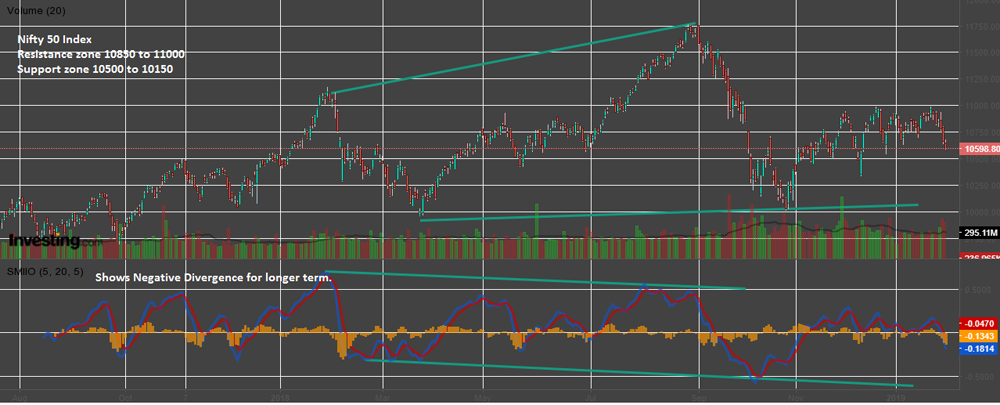
Chart 3. Nifty chart since Aug 2017 to present.
We can see in chart 3, Nifty TSI indicators shows major negative divergence since sept 2018 when Nifty made high of 11750 level.
We witnessed small correction from 10950 level to 10600, breaking out the rising wedge pattern towards level of 10500 and even lower than that near support of 10150. Nifty forming head and shoulder since 2018 jan with neckline support of 10000, left shoulders near 11180 and right shoulders at 11000 with small resistances which never got breached in 2019.
All are showing a correction and tells market going to be a highly volatile in this budget and election time.
1 comment on this post